Think of all the economists around us today trying to predict the next big financial crash. What’s worse? We now get that information in real time through our phones. But we aren’t the first generation to obsess over market trends, and we certainly won’t be the last. In fact, acquiring immense wealth pretty much started as an obsession when money first formed as a concept in history. One person in the 1800s attempted to predict market trends known as the Benner Cycle. The forecasts have been surprisingly accurate – even almost 200 years later. Continue reading to learn more about the Benner Cycle, how accurate it is, and how you can use it for your own investing decisions.

Table of contents
What is the Benner Cycle?
The Benner Cycle was created by Samuel Benner, an Ohio farmer. It was originally published in 1875 within a book called Benners Prophecies: Future Ups and Down in Prices. Benner was determined to understand how market cycles worked. In his book, he forecasted business and commodity prices over a few hundred years. Much of his predictions focus on human emotions, like hysteria or optimism, that ultimately impact markets. Below is a photo of the Benner Cycle from the original book.
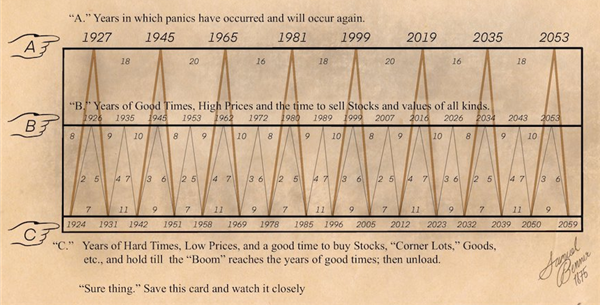
As you can see above, there are three pointers on the left. These indicate three phases of market cycles, which are defined as follows:
- Panic (Point A): In these years, the markets are panicked. Investors are either buying or selling assets without active thought and consideration. As a result, the price will peak and fall in extremes, which only further fuels the panic.
- Good Times (Point B): High prices are experienced during these years. Therefore, it’s a good time to sell off investments to reap the benefits.
- Hard Times (Point C): Recessions, possibly even depressions, are experienced during these years. Markets are low, which means prices are also low. In these times, it’s a ideal to buy assets and hold them until the next economic boom.

Download Your Free Guide
6 Tax Strategies for Canadian Investors with $500k Portfolios
By understanding these different peaks and valleys of the market, one can create wealth. If you can time the purchase and sale of your investments in accordance with market cycles, you can produce wealth. Or at least, that was Benner’s intention to forecast. Naturally, this is easier said than done. Being able to separate yourself from the market is challenging. Investors are human too and may feel the effects of the panic, good times and hard times, thereby failing to think rationally about investments.
Related Reading: The Three Phases of Managing Cash Flows
Is the Benner Cycle accurate?
At the bottom of Benner’s chart, he writes, “Sure thing. Save this card and watch it closely.” Now that we’re in the 21st century, we can reflect on the Benner Cycle and assess its accuracy. Let’s compare some major financial events from the last 100 years against the Benner Cycle:
The Great Depression, 1929 to 1941
The stock market crashed in 1929 and recovered during World War II in 1941. Benner’s chart says 1926 and prior were good times and 1927 was a period of panic. The year 1942 was the bottom of the hard times. While it may not be exactly on the dot, Benner predicted the Great Depression pretty accurately, give or take a few years.
Oil Crisis, 1973
As a result of an oil embargo in October 1973, the price of oil increased drastically. The stock market was negatively effected too. The price of oil did not fully recover until the mid 80s. In Benner’s chart, he predicted 1972 would be years of good economic times and 1978 would be hard times. This aligns with the oil crisis of 1973 pretty well.

START WORKING WITH A WEALTH MANAGER NOW
Black Monday, 1987
A large, unanticipated crash occurred on Monday, October 19, 1987. It is unclear what caused Black Monday exactly. However, experts theorize it’s because of surging bull market that was overdue for a correction. Benner’s Cycles are a bit off having predicted this crash to be in 1985, but it’s only a few years off!
Dot Com Bubble, 1995 to 2002
The stock market rapidly rose as a result of website investment from 1995 to a peak in 2000. Following this intense rise, the dot com bubble burst in 2002. Through 2001 to 2003, there was also a recession that primarily affected the United States. Benner’s Cycle show that 1999 was a period of panic, which is true considering the Y2K bug fear and investors pouring money into internet ventures. Had people sold their assets in 1999, they would’ve weathered the storm. He was a bit off with 2005 being the low point, since 2002/2003 was the accurate year.
The Financial Crisis, 2007 to 2008
As a result of aggregate failed subprime mortgages, the stock market crashed in 2007 which bled into 2008. Since the Financial Crisis happened in the latter half of 2007, Benner wasn’t far off with this year being prosperous. After all, many were buying multiple properties in 2007 and the mid-2000s. Had people sold their properties in early 2007, they would’ve avoided the crisis altogether. He was a bit off with 2012 being the crash year, but otherwise pretty on the nose.
Interestingly, Benner has been quite accurate, give or take a few years. This is particularly noteworthy considering all the fancy technology and metrics we have in the financial world today. Benner was a farmer, but he was a wise financier too! He used his knowledge of supply and demand of crops to inform his predictions. Turns out, the same logic applies.
Related Reading: Top-down and Bottom-up Analysis
What are the 4 phases of the investment cycle?
Samuel Benner isn’t the only one to have evaluated market and investment cycles. Many experts have attempted to understand the trends markets endure. The most popular to assess is the stock market, given how many people actively participate and the volume of public information available. Typically, the stock market cycle is known to have 4 stages. In turn, these stages inform certain investment decisions and the precise timing of them. Let’s take a look at the market cycle below:
- Stage 1: Accumulation. After a market reaches a bottom, the accumulation stage begins. Once the worst of the worst is over, market participants begin buying and investing again. Normally, the market is still bearish at this point, but the negativity from the crash is eliminated.
- Stage 2: Mark-up. Next, valuations of assets and investments begins to climb above normal levels. At the same time, unemployment and layoffs are still prevalent. In this phase, the market turns from bearish to bullish, but it’s still early days. Although, market participants involved may feel euphoric and excited by the rising valuations.
- Stage 3: Distribution. In this phase, market participants begin to distribute securities. The market is usually mixed, fluctuating between bearish and bullish. Prices are usually stable throughout this stage, but are fragile. A sudden change in the world, like a political election or supply chain disruption, can negatively impact price.
- Stage 4: Mark-down. This is when the market bottoms and those holding the bag feel the weight of it. This is the final stage of the market cycle, then the accumulation stage begins once again.
START WORKING WITH A WEALTH MANAGER NOW
Related Reading: Fear and Greed Index
Which phase begins after the end of the bullish phase?
The bullish phase is observed in Stage 2, mark-up. Many think the next stage would be bearish, but this isn’t necessarily true. Rather, the market tends to fluctuate between bearish and bullish, overall remaining quite neutral. This is stage 3, distribution, where investments are being distributed.
Because the market doesn’t clearly flip flop between bear and bull markets, it can be hard to predict what will happen. Especially since markets can appear to be fine right before a crash. In a weird way, when things feel like “business as usual”, you should be worried!
What market cycle are we in now?
It’s hard to say for sure what market cycle we’re in now, but it’s most likely the distribution phase, perhaps nearing the mark-down phase. Lately, markets have been volatile, flipping between bull and bear markets. Unfortunately, this might mean a stock market crash is impending.
Plus, according to the Benner Cycle, we are due for “hard times” in 2023. Benner predicted 2019 would be the year of panic, but in reality it was 2020. If this has you worried, try not to panic (pun intended). Civilizations have gone through economic ups and downs for centuries – and we’re still here to tell the tales! If you feel some type of way about this forecast, 2023 and the next year or two, will be good years to invest. If you have the capital at your disposal, be intentional with your next investment.
Using the Benner Cycle for your Investments
Considering that Samuel Benner published his forecasts in 1875, he’s been pretty on the nose. He’s only been a few years off from predicting some major financial crises. The Benner Cycle shouldn’t be taken literally at face value. But rather, used as a general guideline for forecasting periods of highs and lows in markets. From there, you can perform more analysis and due diligence to pinpoint the purchase and sale of your investments for optimal profit.
Read More: How do world events affect the stock market?
START WORKING WITH A WEALTH MANAGER NOW